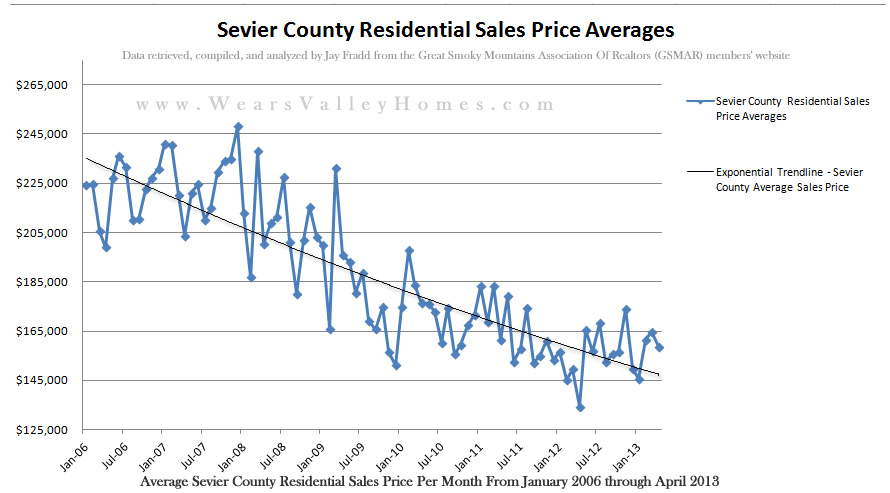
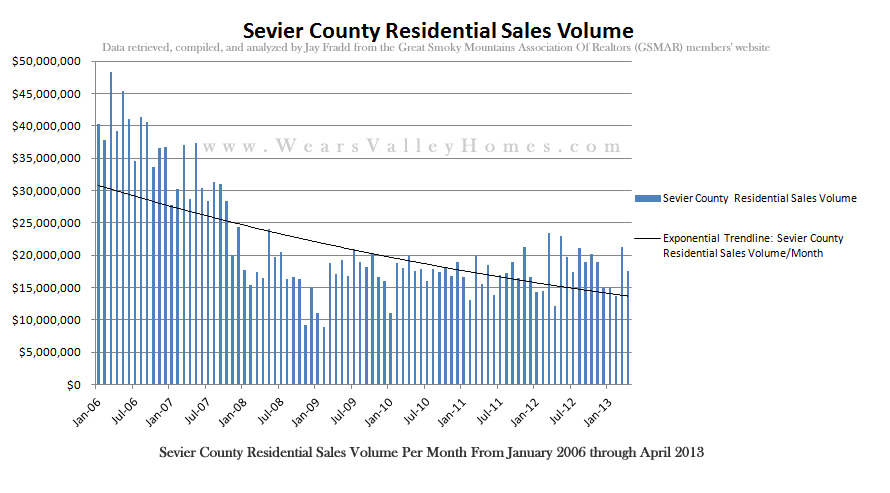
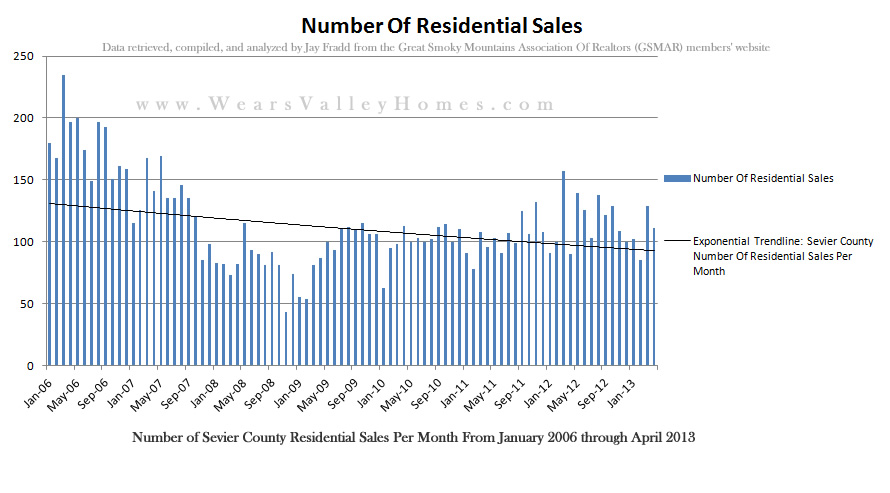
In order to keep aware of the developing trends and changes in our local real estate market I frequently pull the overall sales statistics from our local MLS. Below are graphs indicating various statistics including the average residential sale price in Sevier County (per month & per year), the overall residential sales volume per month in Sevier County, and the number of residential sales in Sevier County per month.
Please note these figures and graphs include both primary residence residential properties along with overnight rental cabins and second homes. So, these graphs are indicative of the Sevier County market in its entirety, not just the cabin market. It would be very labor intensive and time consuming to evaluate the cabin market accurately due to the way our MLS is setup and the Realtor input on properties. For instance, not all Realtors classify the exterior of a property correctly as being a log home or have the use of the property as an overnight rental cabin correctly identified. With that being said, below are the graphs I created for the Sevier County Residential real estate market from 2006 to April 2013.
(Click the graphs in order to enlarge and better visualize the data)


